News archive
JPEG Saver 5.11
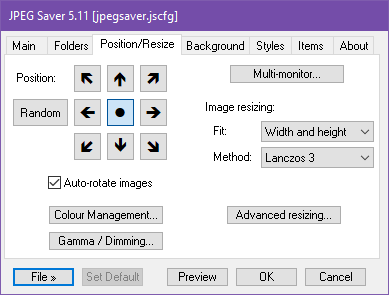
It has been less than a month since the last version of JPEG Saver, but here is another one that does something quite important. There are some other changes, but first comes a big resizing update:
Embiggening
In this version I have improved the resizing options by making them more flexible, more configurable and also less complicated for people who don't want to mess around with loads of options. To make that a bit clearer, here is the less complicated version:
JPEG Saver 5.10
Here is another JPEG Saver update, not a very exciting one but it does have some useful changes. So the following is a list of all the modifications, in order of how obvious they would be if I didn't point them out:
Something Better Change
I've added a new change mode called “Sequential / Chronological”, and rearranged the order that the change modes appear in the drop-down list. The new mode displays images in chronological order within each folder, the folders being chosen in order from the folder list.
I think this is the first time I have changed the order that the change modes appear in - until now they were in the order that I added them, so there wasn't really any logic to the order. You might argue that there isn't much logic now either, but I did actually put some thought into it.
JPEG Saver 5.9
JPEG Saver 5.9 is another update that adds something from the darkest regions of my to-do list: user-defined keyboard mappings. And some other stuff.
Cosmic keys to my creations and times
Yes, you can now choose your own keys for all the various functions that JPEG Saver can do while it is displaying images. The new dialog for editing the keys is accessed via an “Edit keys...” button in the Interactive options dialog.
The dialog contains the list of all functions and their current and default key bindings. Click an item to select it, click the edit box below the list and press the key combination you want to use, then press the “Use” button. Or press the “Reset” button to revert to the default mapping instead.
SVGGraph 3.6
SVGGraph 3.6 is a fairly small update, with a few fixes, a couple of useful extra options and one new feature that I plan to expand upon in future versions.
Multi-level axis division labels
This is the new feature, something I have actually been thinking about for
quite a long time. It is enabled with the new axis_levels_h or
axis_levels_v options, along with some method of providing the text
for the new labels.
JPEG Saver 5.8
So here it is, after years of looking at the word “video” on the to-do list and deciding it sounded too much like hard work: version 5.8.
Video Killed the Radio Star
Yes, version 5.8 does add support for loading and playing videos. The main tab in the config dialog has a checkbox to enable loading video files and a button to take you to a dialog to configure what happens next.
If you just enable the main video option and disable the others, JPEG Saver will load the first frame of the video and use it like any other image type. If all your videos fade in from black that could be a bit boring, so I might have to improve that in the future.