News archive
SVGGraph 3.4
Welcome to the end of year to-do list fix fest, where I've gone through the to-do list for SVGGraph and tried to do as many as possible. This might seem like a bit of a random way to get things done, but it means I crossed off an item that has been there since early 2016 so I would call it a win.
The Coming of Shadows
The first of the new options adds support for displaying drop shadows on the graph:
This is actually my second attempt at getting shadows working. The first time
I tried duplicating the shapes and changing the colours, but it didn't work at
all well. This time I have used an SVG <filter> element to
copy, desaturate, offset and blur the graph features to make the shadow, which
gives a simple and consistent result for all graph types. The downside is that
SVG filters might not be very well supported by some SVG to PDF libraries, so
they might not show up if you try converting to PDF.
TrayBlank 1.10
TrayBlank 1.10 is a small update that does something really useful. Well, I will find it useful anyway. I'm not really sure if anyone else finds TrayBlank useful at all. Maybe I'm just making it less useless.
Up until now TrayBlank's progress bar has shown the progress until the screen saver starts. Unfortunately, it didn't take one important thing into consideration - the power management settings. I kept seeing the progress bar chugging along before the screen went black as the monitor switched off without the screen saver starting up.
The update adds in the monitor power-off time to the icon tooltip, and also changes the progress bar when the screen saver is going to be preempted by the power management settings. Instead of the solid bar that gradually changes from blue to red, the bar will be a sort-of zig-zag line in yellow. I tried quite a few shapes and colour combinations, but this seemed like the one that was most obviously different from the normal progress bar.
SVGGraph 3.3
SVGGraph 3.3 is another update that looks like it has very little in it. Here's the most obvious change:
The ArrayGraph is a new graph type that uses subgraphs to split datasets out and draw multiple graphs on one document. It is a bit limited at the moment, but I thought now would be a good time to release it and see about improving it later. Some details of the ArrayGraph and how to use it have been added to the other graphs page.
JPEG Saver 5.5
JPEG Saver 5.4 was a big, complicated update that didn't appear to change very much at all, so I've tried to get some more interesting things into version 5.5. I haven't done much with the multi-monitor support recently, so that was where I started:
New multi-monitor options
I had to update the multi-monitor options dialog to add in some new settings, so now it looks like this:
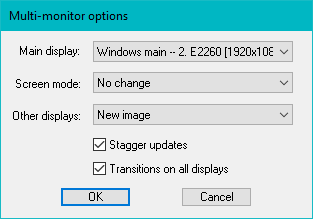
The first change is in the “Main display” option. Previously you could choose which of your displays JPEG Saver should use as its main display, but now you also have the option of using whichever display is set as the Windows primary display as your main display. If you change your primary display in the Control Panel settings, JPEG Saver will automatically use the new primary screen.
SVGGraph 3.2
SVGGraph 3.2 is a fairly minor update, adding a few new options but mostly fixing things. The first thing on the list uses a new option to fix a problem that has been around for a long time.
Zero length axis
The most important new option is axis_fallback_max, which
defaults to 1 and sets the value for the end of the axis when SVGGraph can't
figure it out from the data. Up until now passing in data with all the values
being 0 resulted in an unhelpful “Zero length axis” error message,
since I didn't want to choose an arbitrary value to put at the end of the axis
in case it didn't make sense for the intended use of the graph.
Now the Y-axis will end at the value of the axis_fallback_max
option if there are no non-zero values and the axis_max_v option
(or axis_max_h option for horizontal graphs) is not set. So this
means I have finally chosen an arbitrary value, and it is 1*.