News archive
JPEG Saver 4.19.2
JPEG Saver 4.19.2 is another bugfix release. The main bug fixed in this version is a crash when using the “Desktop” or “Desktop Pile” backgrounds. I've also fixed the items editor not remembering the item name or its enabled/disabled state when creating a new item.
There are two new transitions in this version, “White Out” and “Colour Fade”. They both fade the current image out then fade the new image in, with “White Out” fading to white in between and “Colour Fade” fading to the colour in the centre of the first screen in between.
The new version is available from the downloads page.
JPEG Saver 4.19.1
This shouldn't surprise anyone - the first new JPEG Saver release since I moved all the drawing code around and added in Direct2D and DirectWrite just fixes a couple of bugs. Not very exciting bugs, either.
The first bug was the image filename being forgotten when the image was being processed. This meant that some of the interactive options were failing in new and unusual ways (not just the usual ways that they fail because of the separate desktop that Windows runs screensavers on).
While I was fixing that one I discovered another bug - memory was being allocated for a copy of the image, which wasn't being used. This one didn't do any harm because the memory was released again soon after, but it might have slowed things down a bit.
TrayBlank 1.8
Version 1.8 of TrayBlank fixes a few things that have been bugging me about version 1.7, including a bug that is still bugging me now that it is fixed. It really is fixed though.
The changes all affect the way TrayBlank behaves when the screensaver is not set - in other words, when the “Screen saver” drop-down in the Control Panel's “Screen saver Settings” dialog is set to “(None)”. Now when TrayBlank finds that the screensaver is not set its “Start screensaver” and “Configure screensaver” menu options are greyed out, and the progress bar showing the time until the screensaver starts is not shown.
The text in the tooltip is clearer now too - it was a bit muddled before, but now the name of the screensaver and the timeout are displayed on separate lines, or there will be a message telling you the screensaver is not set.
JPEG Saver 4.19
So here is JPEG Saver 4.19, looking very much like the last version. But go to the “About” tab in the config dialog and you will find a button marked “Debug…” (because I couldn't think of anything better to call it). Clicking the button will open this new dialog:
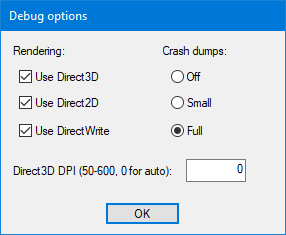
The “Use Direct3D” and “Crash dumps” options have been in JPEG Saver for a while now, but were only accessible by editing the config file by hand. The other options are new in version 4.19. I will now attempt to explain what they do:
JPEG Saver 4.18.2
Yes, this is another bugfix version of JPEG Saver. There is one bug fixed in this release: using random positions for items was making JPEG Saver crash when it started up. There are no other changes in this version.
I am working on JPEG Saver 4.19 at the moment, which is progressing slowly. As I said last time, I want to get some decent support for DPI awareness, and so version 4.19 will be using DirectWrite for its text output, falling back to the old GDI text output if DirectWrite is not available (or if you turn it off from the config dialog). It will also be using Direct2D in places where it previously used GDI or GDI+, so there is quite a lot that needs changing.
Version 4.18.2 is available from the downloads page.