News archive
JPEG Saver 4.18.1
Version 4.18.1 of JPEG Saver is a quick bugfix release, fixing a quiet crash that happens when loading the tags/keywords from some images. It might not look much like a crash because JPEG Saver has a built-in crash handler, but if JPEG Saver is exiting seemingly at random, then that is likely to be a crash.
Of course, JPEG Saver is primarily a screen saver and so it doesn't try to keep running when other programs want to get your attention. But if you think JPEG Saver is going away when it clearly shouldn't, please get in touch and I'll see if it is something that needs fixing.
I've used this update to upgrade a couple of the libraries that JPEG Saver uses, but apart from that the only other change is switching on the most basic DPI awareness setting. Proper DPI awareness is something I want to get working in JPEG Saver, so if you have any problems with scaling or any more general suggestions, I'd be pleased to hear from you.
SVGGraph 2.24
SVGGraph 2.24 is one of those releases that doesn't look like much, but took
ages anyway. The most obvious change in this version is the addition of the
SemiDonutGraph graph type, which looks like this:
It's just half a donut graph, really. The code of the SemiDonutGraph is very
simple and mostly relies upon setting a new option added for all pie graphs
called end_angle, which tells SVGGraph where the circle should
end. There is another option to go with it, slice_fit which is
enabled by default and positions the partial pie graph so that it is scaled to
fit the available space.
CRCDropper 3.5
So it's a new year, and the first new release of the year is... CRCDropper 3.5. The previous version of CRCDropper was released in 2012, so this update might surprise some people. I'm surprised it has been nearly five years since the last time I worked on CRCDropper, but here we are.
Anyway, what does this new version do? The main change is that version 3.5 has a config file: a text file that is stored in the same folder as the CRCDropper executable file and uses the same format and code as used by JPEG Saver. The config file stores the window position and size, the selected hash algorithm and the value of the new options.
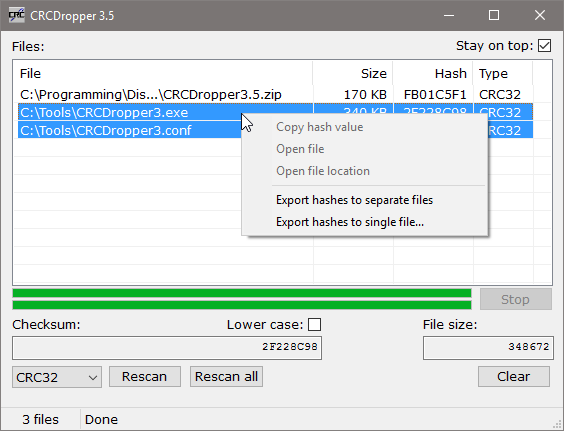
The new options are “Stay on top” to keep the CRCDropper window
above other windows, and “Lower case” to output the hash values
using lower case 'a' to 'f' instead of 'A'
to 'F'.
JPEG Saver 4.18
Version 4.18 of JPEG Saver does not contain many visible changes, but it does have a couple of updates that I have been promising for quite a long time.
But first, something I have removed from this version is support for Windows XP. Microsoft stopped supporting XP a couple of years ago, so writing software that supports it using Microsoft development tools is becoming more and more difficult. So I decided it was time to give up, and set the compiler to target Windows 7 as the minimum version supported. Checking the Goat 1000 web stats showed that I had even fewer visitors using Vista than XP, so Windows 7 it is.
The first of the promised changes is filtering by tag. The tags JPEG Saver uses are scanned from the EXIF and IPTC keywords fields in the image files at the same time as the width and height, then stored in the database. So if you intend to try filtering by tag, I recommend using the “File » Clear database” option to force a rescan beforehand.
SVGGraph 2.23.1
This version of SVGGraph mainly fixes a few bugs, but I have added one new option too. It doesn't do anything visual, so there is no example graph to show for it.
The new option is datetime_key_format, for use with the
datetime_keys option added in version 2.23. This new option allows
you to specify a format for parsing your keys instead of relying on PHP
recognising the format. The format string is described on this PHP manual page:
DateTime::createFromFormat.
The first of the bugs fixed in this version is also related to the
datetime_keys option, solving a nasty error when using multiple
dataset graphs without structured data.