News archive
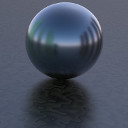
JPEG Saver 4.16
JPEG Saver 4.16 is mainly a bugfix release, but there is one fairly major change that I think justifies version number 4.16 instead of 4.15.1.
First things first, the bug that is fixed in this version took about a month of confusion, testing, updates, more testing, rinse, repeat, etcetera between the user who reported the problem and myself before we found where the bug was and how to fix it. The problem was that the colours on his PCs were messed up - the red and blue components of the images and almost everything else on the screen were swapped. This happened overnight after a Windows update, which didn't help. In the end I traced it back to a problem with a DirectX texture, so this version fixes that and the colours are back to normal. Phew.
The one new feature in this version starts with an extra option in the installer marked “Windows Explorer integration”. What this does is add an extra entry to the Windows Explorer folders right-click context menu, named “JPEG Saver slideshow”. Choosing this option will start up JPEG Saver loading images from the selected folder, using your current config file but without its folders, filters or aspect ratio option. There are a couple of extra options in the “Interactive options” dialog so you can choose whether to use sequential mode and random start or not when using the slideshow. The selected folder is scanned recursively for images, so don't be surprised if it spends a long time “Finding images…” when you point it at your Program Files folder.
TagCanvas 2.9
TagCanvas 2.9 adds a couple of new options, adds some extra ways to colour
the highlight and adds in missing support for the pulsate option.
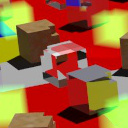
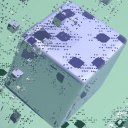

The cloud above demonstrates a couple of the new options added in this version.
First, when you move the pointer of a tag you will see the highlight outline is
displayed using “marching ants”. This is configured using the new
outlineDash, outlineDashSpace and
outlineDashSpeed options. The first one sets the size of the dashes
in pixels, outlineDashSpace allows you to set a different sized space
in between the dashes, and outlineDashSpeed lets you specify how
fast the dashes move. The example cloud is using a dash size of 10 and a speed
of 4. The default speed is 1 (which is quite slow) and you can also use negative
values to make the dashes move in the opposite direction.
You may also have noticed that the highlight colour is not the same for all
the tags in the example cloud above. Version 2.9 of TagCanvas has three ways to
set the highlight colour for individual tags - the example is using the
outlineColour option set to “tag”, which tells TagCanvas
to get the highlight colour from the text of the tag's <a>
links. It also supports a value of “tagbg” to use the background
colour from the links instead. The third option for setting the highlight colour
individually is to set the weightMode to “outline”,
which colours the highlight using a weight gradient in the same way that the
“colour” weight mode sets the tag text colour according to its
weight.
SVGGraph 2.20.1
SVGGraph 2.20.1 is mainly a bugfix release, though I've fitted in a couple of new options as well. The main bug fixed in this version is in the calculation of unit values for shapes (and custom labels) when the graph axes are not in the bottom left of the graph. This happens when you have negative values or adjust the axis minimum value.
The second bug is very minor - passing an array containing a single value as a colour was being parsed as a gradient. This caused an error because there were too few colours, so now SVGGraph will just use the single colour.
The first of the new options is bar_width_min, which gives you a
bit more control over the automatic bar sizing. Up until now bars have always
had a minimum width of one pixel, and the option will continue to use a value
of 1 by default.
SVGGraph 2.20
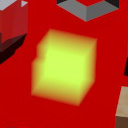
There are two major new features in version 2.20 of SVGGraph, both of which are demonstrated in this example:
The example is a simple BarGraph with the vertical axis maximum increased a
bit so I can fit in some extra stuff. The extra stuff in this case is made up
of shapes and custom labels - configured using the new shape and
label options. All of the graph types support shapes and custom
labels, but the grid-based graphs also support positioning and sizing them on
the grid and in grid units.
These new options each have a new page to explain how to use them in detail: shapes and custom labels.
JPEG Saver 4.15a
I've learned something new in the last week - if you want the code you build with Visual Studio 2015 to run on Windows XP, you need to change the project build toolset from “Visual Studio 2015 (v140)” to “Visual Studio 2015 - Windows XP (v140_xp)”. A similar change is required for Visual Studio 2013 too, but I skipped that version.
So this JPEG Saver update is a change to a compiler option with all the same code, which is why I haven't updated the version number. If you are not running Windows XP, this version will not be any different to the version 4.15 released last week. If you are running XP, this version fixes the message about not being a valid Win32 application (and you should seriously consider upgrading from XP to something newer too - Microsoft stopped supporting XP about 18 months ago).
Download from downloads, as per usual.