News archive
JPEG Saver 4.15
To the casual observer, it might not look like much has changed in version 4.15 of JPEG Saver. The casual observer is probably right this time. The main difference in this version is that it has been compiled using Visual Studio 2015, which hopefully should not make much difference at all. Let me know if you find anything broken.
There are some real changes in this version though - there are two new background modes for a start, “Image Pile - Tiled” and “Image Pile - Fit to screen”, which do the same piling as the other pile modes, but do it on top of a background image of your choice, either tiled or scaled to fill the screen.
There is a new interactive option as well. Pressing the “a” key will switch into and out of “folder lock mode”, where the sequence of images will be locked to the folder containing the current image. The folder lock mode and the sequential mode (“Tab” key) can both be used at the same time, if you like (I don't mean press both buttons at once though - it should work, but you'll only see one of the mode change messages).
TagCanvas 2.8
TagCanvas 2.8 is quite a small update, only adding two options and some validation of a couple of the existing options. The canvas below uses both new options and the fixed code.
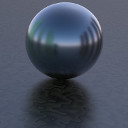
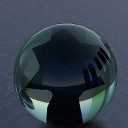

The first new option is imageRadius, and it cuts the corners off
your images to give a rounded effect. The option can be in pixels, or as a
percentage (enclosed in single or double quotes to make it a string). The example
cloud is using '50%' to make the images round (they are actually
128×128 squares).
The second of the new options is scrollPause, which pauses the
animation while the page is being scrolled. Some browsers (especially on mobile
devices) struggle to display the page when there is a lot of canvas animation
happening at the same time as the page is scrolling. This option allows you to
set a delay in milliseconds that TagCanvas will pause for when it receives a
window scroll event. The example cloud is using a value of 200, so you should
be able to notice the slight delay after the page has scrolled and before the
animation resumes. This option is disabled by default, though it should not do
any harm to enable it for all browsers.
SVGGraph 2.19.1
Version 2.19.1 of SVGGraph is a quick bugfix release, fixing one clear bug, some behaviour that was a bit inconsistent, and adding in a new callback option that should really have been there before.
The bugfix is to the stacked and grouped bar graph. Depending on the values in the graph it could calculate the height of the bars incorrectly, meaning that the automatic axis scale selection would chop off the tops of some bars. This version fixes that calculation error.
The inconsistent behaviour was in the structured_data option,
which can best be described by a table:
When is structured data enabled?
structure not set |
structure present |
|
structured_data not set | off | on |
structured_data = TRUE | on | on |
structured_data = FALSE | off | off |
SVGGraph 2.19
The main change in version 2.19 of SVGGraph is the addition of a Histogram graph type. I haven't considered adding one until now because I figured people could work out how to do it for themselves and use one of the existing bar graph classes. I've changed my mind - histograms actually work quite differently to bar graphs, so I've produced these two graphs to demonstrate the difference.
The example above is a standard BarGraph displaying the current sizes of the
PHP files in the SVGGraph library. There are a couple of fairly large files and
quite a few smaller files. I've used a simple associative array to pass the file
sizes to SVGGraph. (The actual values might have changed a bit since I generated
them using ls and awk.)
TagCanvas 2.7
TagCanvas 2.7 adds a few simple options, cleans up the touchscreen controls and fixes a couple of little bugs. Here's an example cloud:
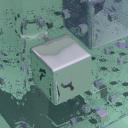
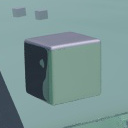
The first thing you are likely to notice about this cloud is the unusual shape - TagCanvas now supports using your own custom callback function to define the shape of the cloud. I added this because Peter Petrov has added a load of interesting shapes to his WordPress plugin and I wanted to make it easier to use other shapes without hardcoding them into the TagCanvas script. There is no new option for this, just provide the name of your function to the “shape” option. There is some documentation and another example on the TagCanvas shapes page.
The list of links used by TagCanvas to draw the cloud above only contains four links. Four tags would not show off the custom shape very well, which is where the new options come in handy. “minTags” and “repeatTags” repeat the list of links to create extra tags in the cloud. “repeatTags” repeats the list a specified number of times, while “minTags” specifies a minimum number of tags, repeating the list as many times as required to reach that number. The options are limited to prevent creating vast numbers of tags, but they should allow for some quite large clouds.