News archive
JPEG Saver 4.10.1
I was expecting a lot of bug reports after the big changes that I made in version 4.10. There really haven't been many, so version 4.10.1 fixes a couple of things and adds a few extra bits and pieces.
The one big bug that was reported to me was also the one that I already knew about: version 4.10 doesn't skip over bad images, displaying an error message instead. I had left the bad image skipping out of that version because the way that it worked in version 4.9 would have had problems with the more multi-threaded environment in version 4.10. For version 4.10.1 I have added bad image skipping back in using a different method.
The first change you are likely to notice in the new version comes when you open up the configuration dialog. All the dialogs open in the middle of the screen now, to prevent them ending up behind the taskbar when it has been moved to the top or side of the screen. After years of them opening in the top-left, I'm still getting used to this change.
SVGGraph 2.14
There is one big change in SVGGraph 2.14 that has taken me a long time to get around to - it now supports patterns for filling in bars, pie slices, and things like the legend background.
There are a load of predefined patterns using spots, stripes, checks, or you can use SVG code to define your own patterns. How to use them is explained on the new colours, gradients and patterns page.
Also new in this version are a few options for displaying labels on stacked
bar graphs that show the totals for each column. The option to enable them is
show_bar_totals, and there are options to control the font, text
colour and spacing.
JPEG Saver 4.10
A lot has changed in version 4.10 of JPEG Saver - so much that I considered calling it version 5. Most of the changes are behind the scenes and could go completely unnoticed though, so version 4.10 it is.
Users have been asking for better multi-monitor support for a long time, and this is the version that finally does something about it. If you have more than one monitor then the “Mode” drop-down list on the “Position/Resize” tab is replaced by a button saying “Multi-monitor…” which opens up this dialog:
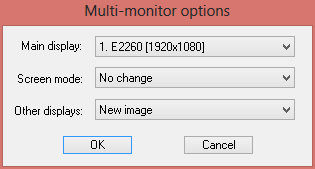 The new Multi-monitor options dialog
This lets you set which screen you want to use for transitions and real-time items, the screen mode of the selected screen and what is shown on the other screen(s) that you have. The list in the “Main display” drop-down is in the same order as the screen numbering in the Control Panel. The monitor name shown here comes from the EDID information stored in the registry, since that is the only monitor description I could find that was better than “Generic PnP Monitor” or “DISPLAY0”. Sometimes the EDID in the registry is completely wrong too, but I'm sticking with it.
TrayBlank 1.4
Version 1.4 of TrayBlank came about because version 1.3 had an annoying habit of disappearing from the tray. I was never sure if it was crashing, closing down cleanly in response to something I was unaware of, or if I was just being stupid and closing it myself without thinking. (I do have a strange tendency to close programs that I'm still using.)
This version should recover better from things that make the tray go away, and if you attempt to run a new copy of the program then it will bring the old one to the front instead of quitting silently.
One genuine new feature of this version is a progress bar - it shows how long it will be until Windows automatically starts the screen saver (if you don't move the mouse or press a key before then). This is just a guess based on how long it has been since the last user activity - many programs can prevent the screen saver from running by sending fake input to Windows or by adjusting system settings.
SVGGraph 2.13
Version 2.13 of SVGGraph adds one new graph type, a few new global options, makes more customisation available in the structured data fields and fixes a few bugs.
The example above shows the new “PopulationPyramid” class in action, a population or age pyramid of values that I pulled out of nowhere. It works like a horizontal stacked bar graph, but with values alternating sides of a central, vertical X-axis. Because both sides are positive, it does not support negative values.
To highlight the strange decline in the male population between the ages of
30-39 on the graph, I've given the bar a thick purple dashed line using some
new structured data fields: stroke_width,
stroke_colour and stroke_dash.
(stroke_dash is also available as a global option for use with all
the bar and pie graphs.)